Examining the Remnants of a Small DDoS Attack
Posted on 03 December 2016 in Technology
On Sunday (27 November 2016) a small website that I advise on was the victim of a DDoS attack that managed to knock the site offline. I received notice on Monday that the website was not working. I was able to ssh to the web server and quickly found that the database service was stopped. After a brief examination of the database logs (nothing too out of the ordinary), I started the service back up and sure enough the website came back online. As the website runs on Drupal, I logged in to take a peak at the Recent log messages and found hundreds of records of log in attempts from a lot of different IP addresses. User accounts on the website are only used by administrators to update content, so it was clear that the site was hit by a DDoS attack!
After getting things back online, I poked around the various log files to try to get an idea of what happened. The Drupal watchdog logs seemed to indicate that the attack started around 15:22 EST and overloaded the server's memory around 15:42 EST. The Apache server's access logs, however, revealed that the attack started closer to 14:54 EST and lasted until 20:57 EST (about six hours). The Drupal watchdog service relies on a database connection, so because that was knocked offline around 15:42 EST, it was, of course, unable to continue recording the events.
Setup
I wanted to evaluate Apache's access logs a little closer, so I imported the logs in to an sqlite table. The access logs are in the Combined Log format: %h %l %u %t "%r" %>s %b "%{Referer}" "%{User-agent}" (host ident user time "request" response-code response-size "referer" "user-agent"). In order to turn this in to a tab-delimited file for import in to sqlite, I used the following regular expression:
0 | (\d+\.\d+\.\d+\.\d+) (.+) (.+) \[(.+)\] "(.+)" (\d{3}) (\d+) "(.+)" "(.+)" |
This regular expression matches each of the relevant pieces of information in to groups that can be used in a replacement expression using your favorite regular expression parser. In my case, I discarded the ident and user fields as they were always empty, further separated the request fields in to three parts (method, request and protocol) and imported all this data in to a table with the following structure:
0 1 2 3 4 5 6 7 8 9 10 11 | CREATE TABLE "access" ( host TEXT NOT NULL, time TEXT NOT NULL, request_method TEXT NOT NULL, request TEXT NOT NULL, request_protocol TEXT NOT NULL, status_code INTEGER NOT NULL, response_size INTEGER NOT NULL, referrer TEXT NOT NULL, user_agent TEXT NOT NULL ) |
Requests
First, taking a look at the total effort:
0 1 2 3 4 5 6 7 8 9 10 11 | SELECT request_method AS method, COUNT() AS requests FROM access WHERE time >= '2016-11-27 19:54:55' AND time <= '2016-11-28 02:56:14' GROUP BY request_method method requests ---------------- GET 55969 POST 9660 |
The time constraints here represent the first and last requests that were clearly a part of the attack. There was some legitimate traffic in this period but it is far outweighed by the attack traffic. This request reveals that there were 55,969 GET requests and 9,660 POST requests during the 6 hours of the attack. This averages out to about 180 requests per minute, or not very much at all.
But a more fine grained query reveals the timing a little better:
0 1 2 3 4 5 6 7 8 9 10 11 12 13 14 15 16 17 18 19 20 21 22 23 | SELECT strftime('%d', time) AS day, strftime('%H', time) AS hour, strftime('%M', time) AS `min`, COUNT() AS requests FROM access WHERE time >= '2016-11-27 19:54:55' AND time <= '2016-11-28 02:56:14' GROUP BY day, hour, `min` ORDER BY requests DESC day hour min requests ------------------------ 27 20 41 4230 27 20 39 2550 27 20 35 2448 27 20 38 2418 27 20 40 2346 27 20 37 2232 27 20 34 1980 27 20 44 1872 27 20 45 1872 27 20 36 1836 [...] |
Between 20:41 and 20:42 (UTC) the server was actually hit with 4,230 requests (about 70 requests per second). This burst is ultimately what knocked the database server offline by 20:42 (the 15:42 EST noted above).
How much bandwidth did all of these requests chew up?
0 1 2 3 4 5 6 7 | SELECT SUM(response_size) as bandwidth FROM access WHERE time >= '2016-11-27 19:54:55' AND time <= '2016-11-28 02:56:14' bandwidth --------- 311446609 |
That's only about 300MB. Consistent with the size of the attack, not very much. It is definitely a lot more than the website in question normally does, but not enough to raise any eyebrows.
Devices
How many devices were involved in this attack?
0 1 2 3 4 5 6 7 | SELECT COUNT(DISTINCT host) AS hosts FROM access WHERE time >= '2016-11-27 19:54:55' AND time <= '2016-11-28 02:56:14' hosts ----- 311 |
Apparently only about 300. This is a far cry from the tens or hundreds of thousands of devices believed to be controlled by the news-making Mirai botnet, but apparently more than enough to defeat a $5/mo VPS instance with a non-optimized Drupal 8 installation.
Next up, which hosts did the most leg work?
0 1 2 3 4 5 6 7 8 9 10 11 12 13 14 15 16 17 18 19 | SELECT host, COUNT() as requests FROM access WHERE time >= '2016-11-27 19:54:55' AND time <= '2016-11-28 02:56:14' GROUP BY host ORDER BY requests DESC host requests ------------------------ 213.251.182.115 3738 212.114.109.218 2784 138.201.151.94 2448 213.251.182.111 2352 213.251.182.105 1992 213.251.182.106 1734 202.67.9.42 1554 184.106.10.128 1368 213.251.182.114 1338 103.45.230.202 1332 [...] |
After the top ten, things tend to wind down rather slowly to round out the 311 hosts involved. So what can be found out about these hosts? Not a ton, really, other than who each IP belongs to. There are lots of bulk IP whois services available online, I choose a random one and got the following information:
| Domain | IP | ISP | Organization | Country |
|---|---|---|---|---|
| gw-cluster015.ovh.net. | 213.251.182.115 | OVH SAS | OVH SAS | FR |
| server2.duurzaammedia.nl. | 212.114.109.218 | Whitelabel Hosting Solutions | Whitelabel Hosting Solutions | NL |
| static.94.151.201.138.clients.your-server.de. | 138.201.151.94 | HOS-181062 | HOS-181062 | DE |
| gw-cluster011.ovh.net. | 213.251.182.111 | OVH SAS | OVH SAS | FR |
| gw-cluster005.ovh.net. | 213.251.182.105 | OVH SAS | OVH SAS | FR |
| gw-cluster006.ovh.net. | 213.251.182.106 | OVH SAS | OVH SAS | FR |
| 202.67.9.42 | 202.67.9.42 | Unknown | Mollindo Company Jakarta | ID |
| fw-snet-n01.wc1.ord1.stabletransit.com. | 184.106.10.128 | Rackspace Hosting | Cloud Sites wc1.ord1 | US |
| gw-cluster014.ovh.net. | 213.251.182.114 | OVH SAS | OVH SAS | FR |
| sd108202.server.idn.vn. | 103.45.230.202 | Online Solution Company Limited | Online Solution Company Limited | VN |
Most of these devices appear to be hosted on OVH, and Rackspace is another big player represented here. This likely indicates that the devices are either compromised websites or rented machines set up specifically for DDoS'ing. Either way, this attack was not orchestrated from the insecure IoT devices that many fear will continue to grow massive botnets in the coming years.
Locations
There is also a fair distribution of locations for those top ten hosts - France, Netherlands, Germany, Indonesia, the United States and Vietnam are all represented. So where did all of the devices come from?
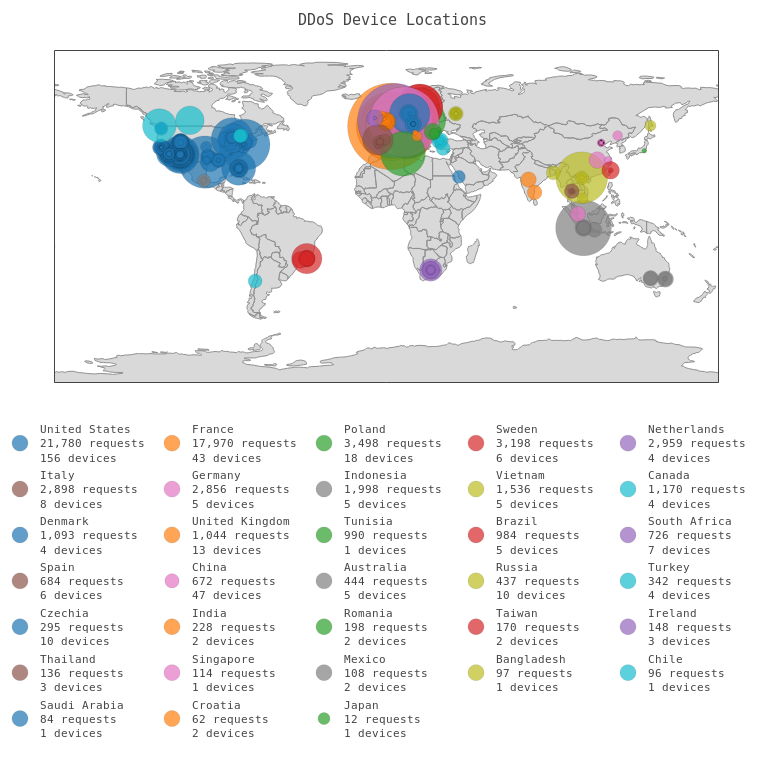
For a nicer view, open a full screen view of the map above.
This fuller picture reveals that in addition to the high concentration of requests from OVH servers in France, there were also a lot of compromised devices in certain American cities. Who owns the networks these devices sit on? This time around I used InfobyIP's Bulk Lookup Tool, which kindly does not limit the number of lookups per day (or at least I didn't hit the limit):
- In Scottsdale, Arizona, all devices are on GoDaddy.com, LLC (GoDaddy) networks.
- In Brea, California, all devices are on New Dream Network, LLC (Dreamhost) networks.
- In Provo, Utah, all devices are on Unified Layer (United Layer)* networks.
- In Fort Lauderdale, Florida, all devices are on InternetNamesForBusiness.com (INFB) networks.
* The United Layer devices appear to be a small mix of regional web hosting services, with the only major outlier being one device on HostGator.
The total requests in these cities were not nearly as high as what came from OVH, but they helped the total number of devices from the United States more than double those from France. These network owners also further advance the theory that the devices were compromised website. It is possible that they were not able to fire off any many requests as OVH's servers because they are smaller website that hit resource caps.
A lot more digging could be done here to identify and report individual compromised websites, but I suspect that would be an adventure of it's own. And one worth taking if time ever allows...
User Agents
All of the devices used in the attack had the same user agent: Mozilla/4.0 (compatible; MSIE 7.0; Windows NT 6.1; Trident/4.0). User agents are very easy to fake, so it's difficult to read much in this. I had not seen the Trident token in user agent strings before and found that it apparently has to do with Internet Explorer's compatibility mode. Perhaps this indicates that the compromised machines used in the attack are servery outdated Windows virtual machines, but there is no definitive way to make that connection.
One other interesting "user agent" string in the logs is () { foo;};echo; /bin/bash -c \"expr 299663299665 / 3; echo 333:; uname -a; echo 333:; id;\". This string, along with requests to some known exploitable entry points, attempts to execute a command to reveal some potentially useful information for compromising the server. If it had succeeded, the attacker would have received the detailed name of the operating system (uname -a) and user and group information for the user running the web server (id).
The part that I was unsure about is the expr 299663299665 command, which is apparently related to the Shellshock vulnerability. The command itself and the result, 99887766555, turn up a number of results on the web but nothing that seems to connect the dots on between the command and the vulnerability.
I suspect that this is an automated worm infection attempt meant to compromise the host being DDoS'd and increase the power of the botnet.
OOM Killer
Ultimately, the DDoS worked like a charm. It only took about 20 minutes to knock out the database server, completely crippling the Drupal-based website. The burst of 4,000+ requests in one minute caused enough hits against the database to trigger the dreaded oom killer, shutting the service down for good (until I brought it back up manually, anyway).
I have run in to oom killer in other low memory VPS situations in the past and it certainly is not a fun issue to iron out. Luckily, this instance was entirely related to the DDoS attack and not some deeper, more obscure memory issue. Once the attack stopped, things were able to return to normal pretty easily.
In the end, I examined some other logs and decided to restore the machine from a previous image just in case. If the site becomes a frequent target of this sort of attack I will evaluate mitigation options, but I suspect that this particular attack was simply a random test of a small botnet.